** New Feature **
STD Integrated Framework
Web & Mobile Debug Introspection
With the release of the new STD Integrated Framework for PowerBuilder and Appeon (version 2015.4.0.43 and higher), the framework was enhanced to expose the Debug/Spy feature that has been available to native PB applications for many releases. The framework's Debug/Spy feature is normally activated by the application user selecting the keyboard CTRL+SHIFT+F1 keys in succession. This key sequence informs the framework to display a dialogue that shows the application user the various PowerBuilder classes in vogue for the dialog in focus.
In the Web Browser and especially in the Mobile world, the keyboard CTRL+SHIFT+F1 sequence is either not recognized or physically impossible on a virtual keyboard. The latest STD Integrated Framework has been enhance to work around these limitations. This feature of course is most valuable to the Application Developer and Quality Assurance personnel to introspect the active classes with a business dialogue. This can be key pieces of information in isolating what components are active within a problem area of an application. However, given hard to pin-point issues in production - even the application business user can be instructed to use this feature to collect critical information about a problem area in the application.
For the Web and Mobile world, the first step in activating the Debug/Spy feature is logging into the AEM (Appeon Enterprise Manager) console for the related Appeon Server that is serving up the Web and/or Mobile application. Within the AEM, navigate to the Application => PB Features => INI settings area of the console. Once located, select your Web/Mobile application's INI file. This file of course will be the one you were supplied with by the STD Integrated Framework. Within the INI file, scroll down and locate the [DEBUG] section and within that area, the "Debug_Mode" keyword. Most likely, the current value assigned to this keyword is "N". You will need to change that value to "N", as shown:
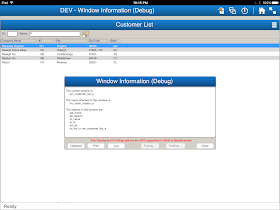
Once the "Debug_Mode=Y" value has been set, restart your Appeon Mobile or Web based application. You should now notice that the Integrated framework has automatically exposed two extra menu features: a) a new Menu Item entitled "Debug" located to the far right hand side of the horizontal text menus and b) a new "Debug" icon appearing to the far right-hand side of all related toolbars. Selecting either menu item or toolbar item will direct the framework to display the following Debug/Spy dialog:
The Debug/Spy icon on the upper menu or its toolbar will direct the Debug/Spy to display the components involved around the Main or MDI "Controller" dialogue. The Debug/Spy icon on the lower menu or its toolbar will direct the Debug/Spy to display the components involved around the Main, Pop-up, Child or MDI_Child dialogue (depending on the application style being used) being displayed.
On the Mobile Android or iOS equipped devices, the menu item text or their toolbar icons are displayed as drop downs available from the AWS (Appeon Work Space) shell when running your PowerBuilder application. Within the AWS, the new "Debug" and icon are displayed similar to the Web Browser above. Again, selecting either the menu text (debug) or its associated debug icon will engage the Debug/Spy framework dialog, as follows:
Once the Debug/Spy dialogue is activated, the application user can copy, print and/or email the component diagnostics to the appropriate support personnel for further analysis. It should be noted though that the Tracing and Profiling (another new feature) are only available to native PowerBuilder applications and thus those options are disabled in the Web and Mobile environments.
I hope that this new innovative framework feature is of significant help when trying to analyze problem areas of your PowerBuilder and/or Appeon applications.
Regards ... Chris


No comments:
Post a Comment